Unglamorous Infrastructure Fixes That Matter: Cutting Observability Costs at Scale
Endure Admin
Cloud & DevOps
Production systems force a particular kind of honesty on you. You design, review, test, and feel good about a system — only to have reality point out, six months later, every assumption you didn't know you'd made. Logs pile up quietly until storage costs get uncomfortable. A service quota gets hit in the middle of a deployment. A telemetry agent that's been humming along for a year suddenly needs replacing because the vendor decided it was end-of-life.
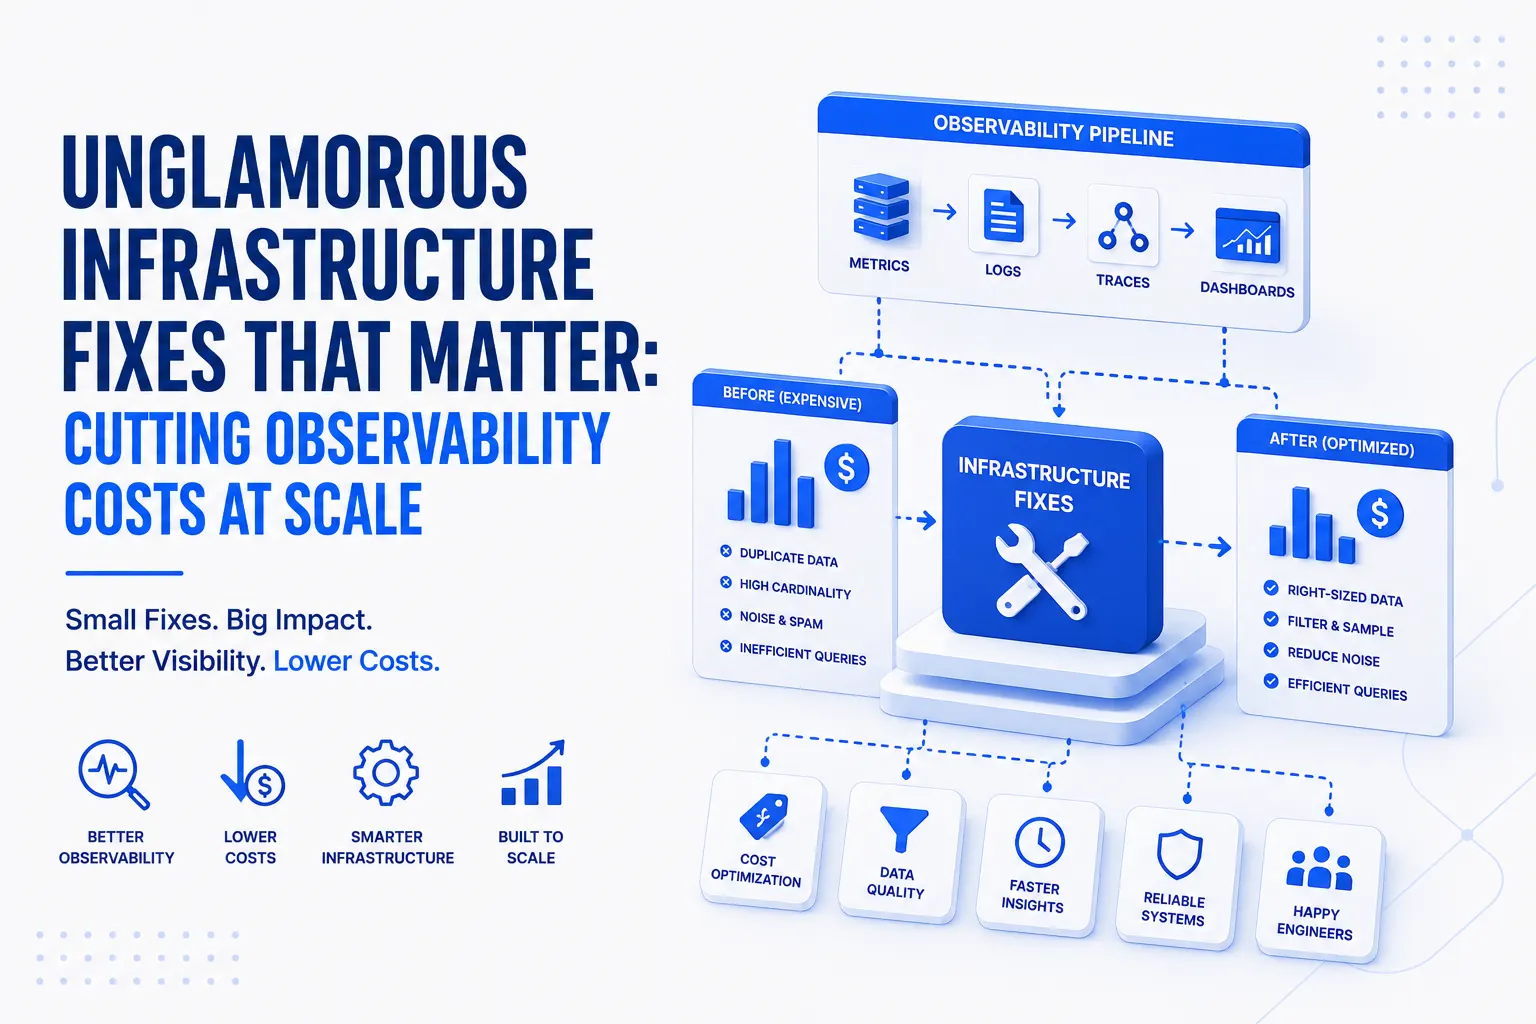
Over the past quarter, our DevOps team invested time in the unglamorous fixes — the reliability, visibility, and cost-management work of cloud infrastructure modernization and observability cost optimization that never makes it into a headline but quietly decides how your on-call week goes.
Let's walk through what we solved, why it mattered, and the lessons worth passing along.
Our Logging Bill Had Gotten Out of Hand
Every observability setup starts out lean and useful. Then, somewhere along the way, it stops being lean. Ours had reached the point where it was genuinely a problem.
We were running Loki and Mimir, and when we actually sat down and looked at what was in there, production Loki alone had piled up more than 4 terabytes of log data. The vast majority of it sat well outside any window where anyone would realistically investigate something — nobody debugs a five-month-old incident using raw logs. That data was just sitting there, costing money, for no operational reason.
So we set a 31-day retention policy across both Loki and Mimir. This part matters more than people usually give it credit for: we went and confirmed that compaction and deletion were actually doing their job in every environment. It's easy to set a retention policy and assume it's working. It's a different thing to verify it.
The results were satisfying. Production Loki went from 4.1 TB down to 1.6 TB. Mimir in our dev environment dropped from 395 GB to 20 GB. That's not a rounding error — that's a real chunk of infrastructure cost gone.
But we didn't apply the same logic everywhere, because not every log tells the same kind of story. For our internal services, we went the other direction and extended retention to 90 days across dev, staging, and production. Some bugs don't show up right away — a runtime exception that only fires under a specific load pattern, a deployment regression that takes a couple of weeks to become visible. Trim those logs too aggressively and you throw away exactly the evidence you'd need to catch problems like that. So the strategy ended up being less "one policy for everything" and more "match the retention window to how the failure actually behaves."
Migrating From Grafana Agent to Grafana Alloy Before End-of-Life Forced Our Hand
Grafana Agent hit end-of-life, and its intended successor, Grafana Alloy, is built around a more composable pipeline architecture — easier to reason about and maintain long-term. We didn't have much choice about whether to migrate. The choice was really just how carefully we did it.
We rolled the migration out across every environment we run — dev, production, and a few supercluster deployments — going through ArgoCD with validation at each stage rather than pushing it everywhere at once and hoping for the best. The thing we cared about most was that nobody downstream would notice anything had changed. Dashboards stayed exactly as they were. Alert rules didn't need touching. Scrape configs didn't need rewriting. Metrics kept flowing into Mimir, logs kept flowing into Loki, and nothing dropped a beat.
While we were in there anyway, we cleaned up some configuration drift that had quietly built up across environments over time — the kind of small inconsistencies nobody sets out to create but that accumulate when different people touch different clusters at different times. So we came out the other side not just with an unsupported agent replaced, but with a genuinely more consistent baseline to build on.
Bringing in ClickHouse for the Queries Loki Was Never Built to Answer
Loki does one thing really well: storing logs and letting you filter by label. What it's not built for is heavy analytical work — frequency distributions across services, cross-service correlation, trend analysis over long time ranges. Ask Loki that kind of question and you feel the latency immediately.
So we brought in ClickHouse to sit alongside it, forwarding logs from dev, staging, and a handful of other cluster environments through Alloy. ClickHouse is a column-oriented database, purpose-built for exactly this kind of analytical querying, and the difference showed up right away: queries that took several seconds in Loki came back in milliseconds through ClickHouse.
We were deliberately cautious about how we introduced it into production. It's deployed there with read-only access controls, specifically so that adding this analytical capability doesn't open up any write-path risk to live data. New capability, same blast-radius discipline we'd apply to anything else touching production.
Catching AWS SageMaker Quota Limits Before They Catch Us
If you've never been bitten by AWS SageMaker quota limits, this might seem too small to write about. The first time it happens in production, you immediately understand why it deserves its own section.
AWS SageMaker applies quotas on things like how many real-time inference endpoints you can run, the number of instances per endpoint, and the total instance count across endpoint types — all scoped per account and region. These limits sit there quietly until the exact moment they don't: a deployment scales under load, a new endpoint fails to spin up, and somewhere in CloudWatch there's an error message telling you a quota got silently exhausted. By the time anyone sees that alert, something's already broken for a real user.
Sadly, SageMaker doesn't give you native CloudWatch alarms for quota utilisation out of the box. You have to build that yourself. So we did.
We wrote a Lambda function running on a scheduled EventBridge trigger. It calls the AWS Service Quotas API to pull the current limits, calls CloudWatch's GetMetricData API to see what we're actually using, and works out a utilisation percentage for each quota that matters to us. Then it updates CloudWatch alarms at two thresholds — 80% and 100%. The 80% alarm gives the team breathing room to request a quota increase before it becomes urgent. The 100% alarm is the backstop for when that didn't happen in time.
Those alerts get routed through SNS and land in a Microsoft Teams channel, using an SNS-to-Teams router we'd already built as its own standalone piece, so we weren't reinventing that wheel. The entire thing — Lambda, the CloudWatch alarms, SNS topics, the EventBridge schedule, the Teams routing — is managed through Terraform and Terragrunt. That was really the point of building it this way: it's not a one-off fix for one AWS service. It's a pattern we can now point at any other service that carries similar quota risk.
Putting VictoriaMetrics Up Against Mimir
As our metrics volume keeps climbing, the cost of running Mimir at that scale becomes a question worth actually asking, rather than assuming the current setup is fine forever. So we spun up VictoriaMetrics in a dev cluster and ran it head-to-head against our existing Mimir deployment in a structured benchmark.
The results leaned in VictoriaMetrics' favour — slightly better query latency, and it did that while using noticeably less CPU and memory. At scale, that's not a trivial gap. We hooked it up as a Grafana datasource and started testing it against our existing dashboards to see how compatible it really was in practice, not just on paper.
We're not fully there yet, though. Mimir currently provides a set of recording rules that some of our dashboards and alert expressions depend on, and those need to be ported over before we can seriously consider promoting VictoriaMetrics any further. That work is underway, but we wanted to be upfront that this one's still in progress rather than a finished story.
Letting Tooling Talk Directly to Infrastructure With MCP
Model Context Protocol (MCP) gives external tools and agents a standardized, auditable way to interact with services, instead of everyone building their own bespoke integration. We deployed MCP servers for Prometheus, Kubernetes, Grafana, and ClickHouse across our cluster environments.
What that buys us, practically, is that DevOps tooling and observability workflows can pull live metrics, log data, or cluster state directly — rather than everyone falling back on static dashboards or manually running a query because the dashboard doesn't quite show what they need. We treated access control here as non-negotiable from the start. The ClickHouse MCP server runs with read-only permissions, and we scoped each MCP server down to only the access its workflow needs. The payoff is faster, more contextual troubleshooting — without widening the blast radius of any one integration.
Why Does This Work Actually Matter?
None of this work would headline a roadmap presentation. Nobody applauds retention policies, agent upgrades, quota alerts, and metrics benchmarks during sprint reviews. Yet this is exactly what separates a platform that absorbs growth from one that wakes somebody up at 2 a.m. without warning.
Instead of chasing a grand architectural master plan, we aimed to solve specific infrastructure problems one at a time — with clear ownership, measurable outcomes, and no interest in solutions that only look good on paper.
Our primary focus this quarter was a shift from reaction to proactive prevention: addressing retention policies before storage blew up, setting SageMaker quota alerts to shape the failure mode before it ever hit us, benchmarking VictoriaMetrics before Mimir turns into an actual bottleneck. That's what mature DevOps practice looks like — identifying potential failures while they're still preventable, rather than writing postmortems after the damage is done.